vScriptValRoseCurve
Generate points on the polar rose r = amplitude * cos(petals * t), with rotation and scale controls.
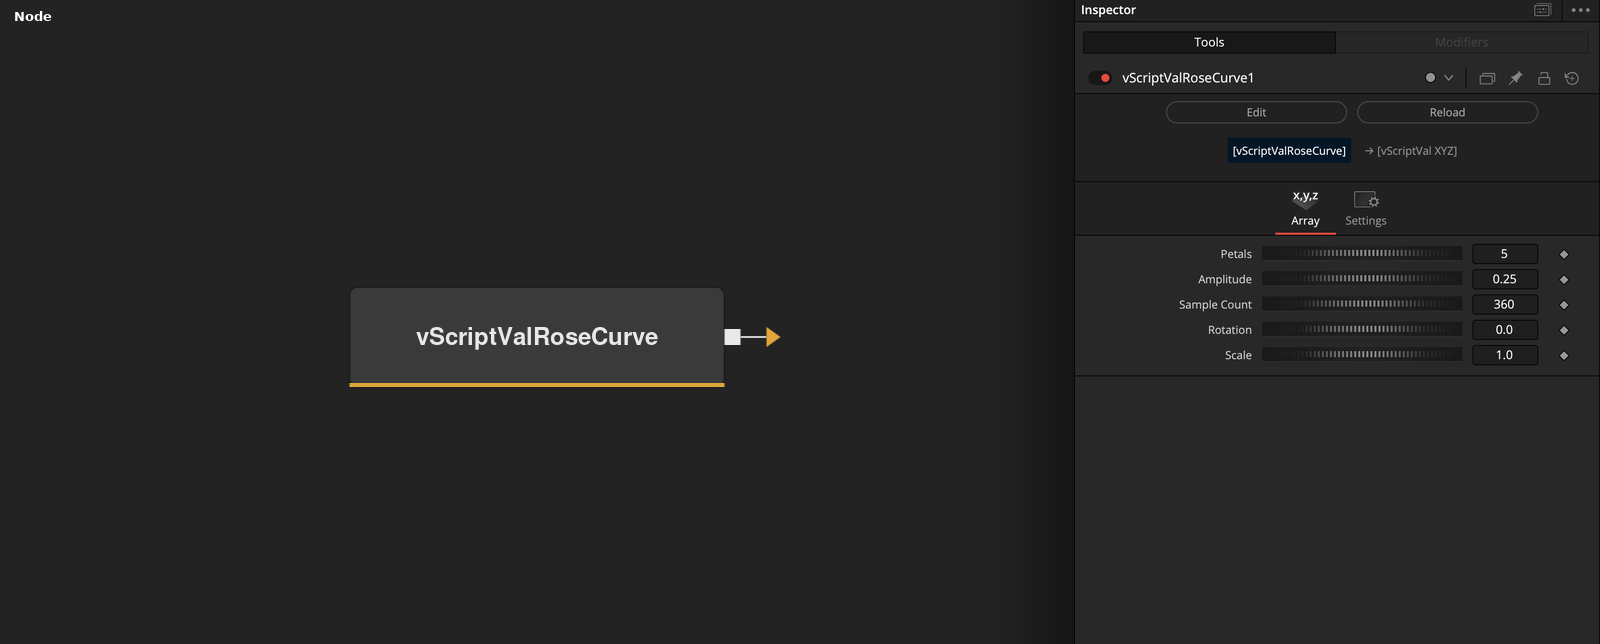
vScriptValRoseCurve has no input and outputs an array of XY points on a rose curve in the Z = 0 plane. Petals sets the frequency of the curve and Amplitude sets its size.
Parameters
| Parameter | Type | Default | Description |
|---|---|---|---|
| Petals | Integer | 5 | Frequency in r = Amplitude * cos(Petals * t). Clamped to 1 or more, default 5. |
| Amplitude | Float | 0.25 | Radius multiplier. Minimum 0.001, default 0.25. |
| Sample Count | Integer | 360 | Number of points sampled over the curve. Clamped to 8 or more, default 360. |
| Rotation | Float | 0 | Angle added to the polar angle, in degrees. Default 0. |
| Scale | Float | 1 | Multiplier applied to X and Y after the radius is computed. Minimum 0.001, default 1. |
Read the full description
The node samples t from 0 to 2 * pi in Sample Count points, including both ends. For each t the radius is r = Amplitude * cos(Petals * t) and the polar angle is t + Rotation. The point is X = r * cos(angle) * Scale and Y = r * sin(angle) * Scale, with Z = 0.
With the defaults (5 petals, Amplitude 0.25, 360 samples, Rotation 0, Scale 1) the curve has five petals, each reaching 0.25 from the origin. The first and last points are the same point.
Petals is a frequency. An odd value gives that many petals. An even value gives twice as many, because the curve covers the full 2 * pi range. Rotation is in degrees and turns the whole curve around the origin.
Petals is clamped to 1 or more and Sample Count to 8 or more. Raising Petals without raising Sample Count leaves fewer points per petal. Amplitude and Scale both multiply the result.
Example Connections
- Draw the rose
- Mirror the rose across an axis
vScriptValRoseCurve.Output -> vScriptValCameraProjection.ArrayA
vScriptValCameraProjection.Output -> vScriptValShapeRender.ArrayPoint
Background.Output -> vScriptValShapeRender.Input
vScriptValRoseCurve.Output -> vScriptValMirror.Input
vScriptValMirror.Output -> vScriptValCameraProjection.ArrayA