vJSONColorMap
Turns a number per point into a color between Color A and Color B.
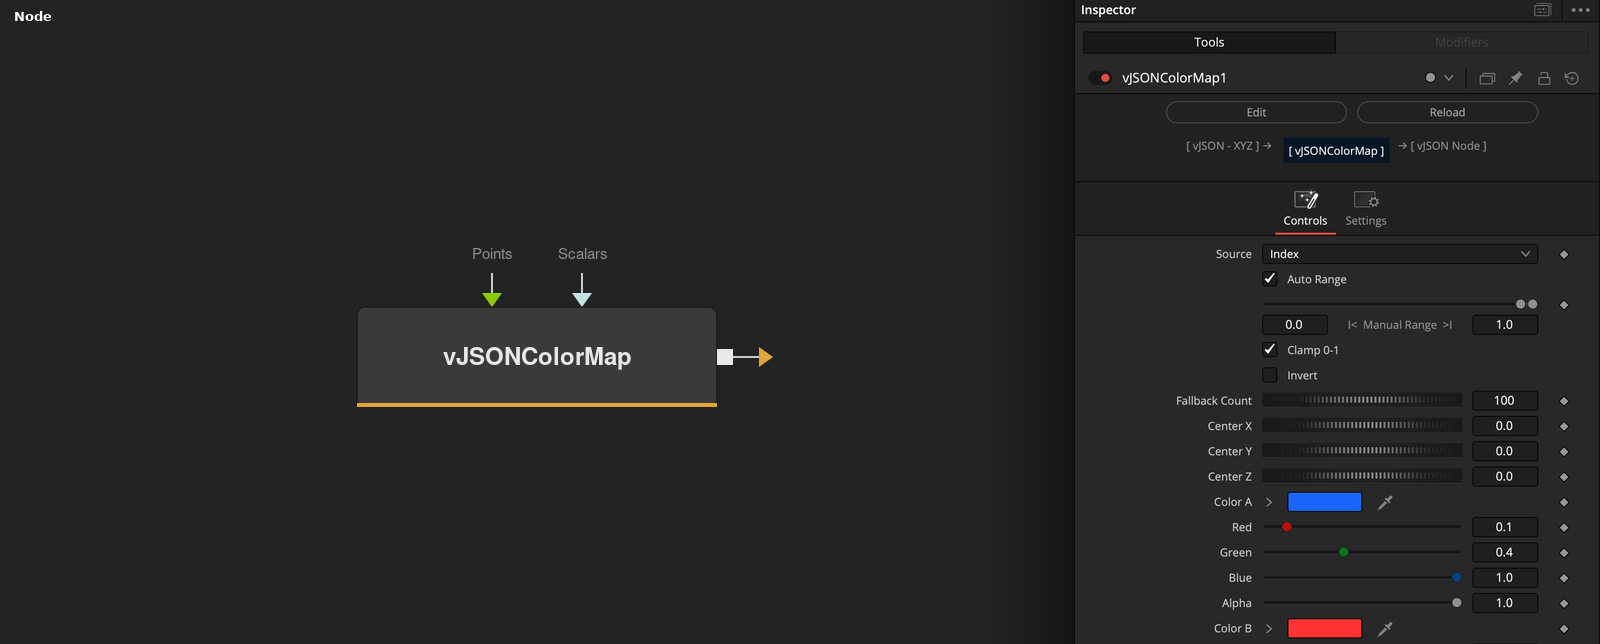
vJSONColorMap reads a value for each index from the index, a scalar array, a point coordinate or the distance to a center, and outputs a list of RGBA colors. The color runs from Color A at the low end of the range to Color B at the high end.
Parameters
| Parameter | Type | Default | Description |
|---|---|---|---|
| Source | Dropdown | Index | Index (default), Scalar Input, Position X, Position Y, Position Z or Distance From Center. The position and distance sources give 0 when no Points are connected. |
| Auto Range | Integer | 1.0 | Uses the smallest and largest value as the range when on (default). |
| RangeMin | Float | 0 | Low end of the manual range. Used when Auto Range is off. Default 0. |
| RangeMax | Float | 1 | High end of the manual range. Used when Auto Range is off. Default 1. |
| Clamp 0-1 | Integer | 1.0 | Limits the position along the gradient to 0 to 1 when on (default). |
+15 more parameters
| Parameter | Type | Default | Description |
|---|---|---|---|
| Invert | Integer | 0.0 | Reverses the gradient when on. Default off. |
| Fallback Count | Integer | 100 | Number of colors when neither Points nor Scalars are connected. Minimum 1, default 100. |
| Center X | Float | 0 | X of the center for Distance From Center. Default 0. |
| Center Y | Float | 0 | Y of the center for Distance From Center. Default 0. |
| Center Z | Float | 0 | Z of the center for Distance From Center. Default 0. |
| Red | Float | 0.1 | Red of Color A, at the low end. Default 0.1. |
| Green | Float | 0.4 | Green of Color A. Default 0.4. |
| Blue | Float | 1.0 | Blue of Color A. Default 1. |
| Alpha | Float | 1.0 | Alpha of Color A. Default 1. |
| Red | Float | 1.0 | Red of Color B, at the high end. Default 1. |
| Green | Float | 0.2 | Green of Color B. Default 0.2. |
| Blue | Float | 0.2 | Blue of Color B. Default 0.2. |
| Alpha | Float | 1.0 | Alpha of Color B. Default 1. |
| Points | Text | — | Optional points. They set the count and feed the position and distance sources. |
| Scalars | Text | — | Optional numbers. They feed the Scalar Input source. |
Read the full description
The number of colors is the number of Points, else the number of Scalars, else Fallback Count (default 100). Source picks the value per index: the index, the Scalar Input value (the first value of a list), Position X, Y or Z of the point, or its distance to Center X, Y and Z.
With Auto Range on, the smallest and largest value become the range, otherwise Range Min and Range Max do. The position t is (value - min) / (max - min), clamped to 0 to 1 if Clamp 0-1 is on, then flipped to 1 - t if Invert is on. The color is Color A + (Color B - Color A) * t per channel, limited to 0 to 1.
A range of zero width gives t = value - min. The output is a ScriptVal list, for example for the Custom Color input of vJSONShapeRender.
Example Connections
- Color a grid by index and draw
- Color by a scalar array
vJSONPointsOnGrid.Output -> vJSONColorMap.Points
vJSONPointsOnGrid.Output -> vJSONCameraProjection.ArrayA
vJSONCameraProjection.Output -> vJSONShapeRender.ArrayPoint
vJSONColorMap.Output -> vJSONShapeRender.JSONCustomColor
Background.Output -> vJSONShapeRender.Input
vJSONWeightMap.Output -> vJSONColorMap.Scalars
vJSONColorMap.Output -> vJSONShapeRender.JSONCustomColor