vJSONVoronoi
Generate Voronoi cell outlines from random seed points, with outputs for points, cell edges and seed positions.
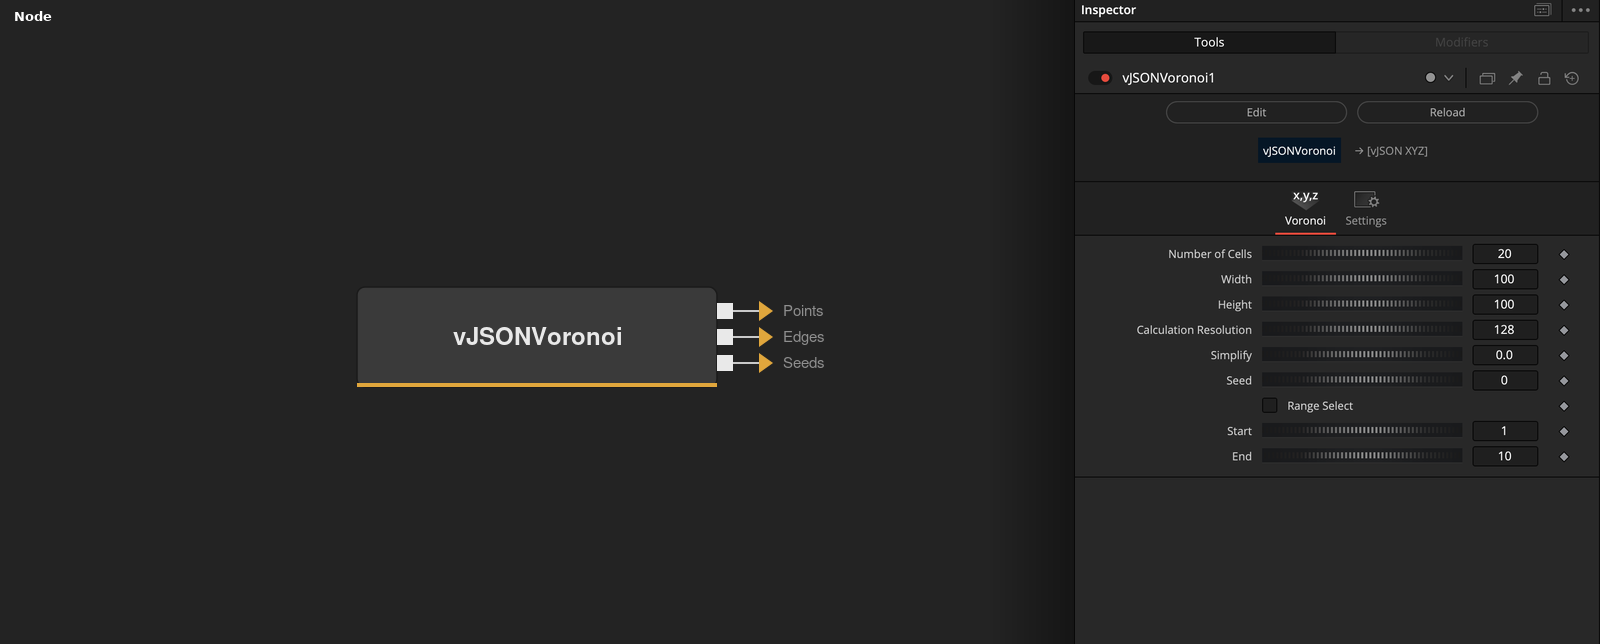
vJSONVoronoi has no input and outputs three arrays: the outline points of Voronoi cells, edge index lists that group those points by cell, and the seed positions. Number of Cells, Seed and the Width and Height ratio shape the layout.
Parameters
| Parameter | Type | Default | Description |
|---|---|---|---|
| Number of Cells | Integer | 20 | Number of Voronoi cells and seed points. Minimum 2, default 20. |
| Width | Integer | 100 | Width part of the aspect ratio of the layout. Minimum 1, default 100. |
| Height | Integer | 100 | Height part of the aspect ratio of the layout. Minimum 1, default 100. |
| Calculation Resolution | Integer | 128 | Number of pixels on the longer side of the grid used for the calculation. Range 16 to 1024, default 128. |
| Simplify | Float | 0 | Tolerance, in grid pixels, for reducing the points of each outline. 0 turns it off. Range 0 to 100, default 0. |
+4 more parameters
| Parameter | Type | Default | Description |
|---|---|---|---|
| Seed | Integer | 0 | Seed of the random seed positions. Range 0 to 1,000,000, default 0. |
| Range Select | Integer | 0 | When on, only the cells from Start to End are written. Default off. |
| Start | Integer | 1 | First cell that is written when Range Select is on. Minimum 1, default 1. |
| End | Integer | 10 | Last cell that is written when Range Select is on. Minimum 1, default 10. |
Read the full description
The node places Number of Cells random seed points on a pixel grid, then gives every pixel to its nearest seed. The grid is Calculation Resolution pixels on its longer side, and its shape follows the ratio of Width to Height. Width and Height set only this ratio. Seed points stay at least 2 pixels, or 2 percent of the grid width if that is larger, away from the grid edge. The same Seed gives the same cells.
Each cell outline is found by following the boundary pixels of the cell. A contour with more than 3 points is thinned by keeping every Nth point, where N is the point count divided by 64 and rounded down. If Simplify is above 0, the outline is reduced further with the Ramer-Douglas-Peucker method, using Simplify as the tolerance in grid pixels. A result with fewer than 3 points is not used.
Points holds the XY outline points of all cells, in cell order. Each point is X = (px / grid width - 0.5) * aspect and Y = py / grid height - 0.5, so the layout is centered on the origin and has a height of 1. Edges holds one list of point numbers for each cell, counting from 1, and Seeds holds the XY position of each seed in the same units. Each list of edge numbers is open, without the first number repeated at the end.
Range Select limits the output to the cells from Start to End. The two values are clamped to the number of cells and swapped if Start is larger. The seeds of those cells are written even when a cell outline cannot be built. Cell outlines are traced on a grid, so they are made of pixel steps, and a higher Calculation Resolution gives smoother outlines and a slower calculation.
Example Connections
- Draw the cell outlines
- Draw the seed points
vJSONVoronoi.Points -> vJSONCameraProjection.ArrayA
vJSONVoronoi.Edges -> vJSONCameraProjection.ArrayEdge
vJSONCameraProjection.Output -> vJSONShapeRender.ArrayPoint
vJSONCameraProjection.Edges -> vJSONShapeRender.ArrayEdge
Background.Output -> vJSONShapeRender.Input
vJSONVoronoi.Seeds -> vJSONCameraProjection.ArrayA
vJSONCameraProjection.Output -> vJSONShapeRender.ArrayPoint
Background.Output -> vJSONShapeRender.Input