vJSONPointsOnGrid
Generate a rectangular lattice of points in X, Y and Z with a set count per axis and one spacing value.
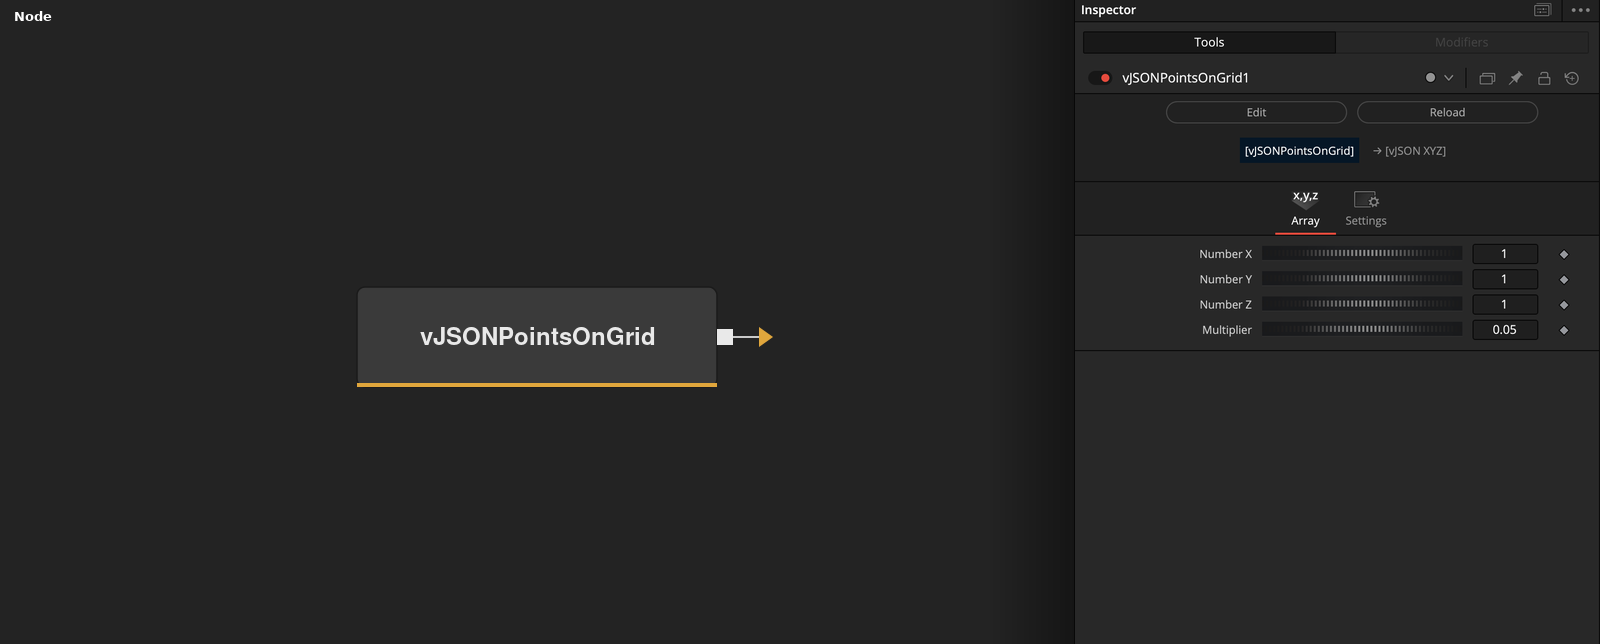
vJSONPointsOnGrid has no input and outputs an array of XYZ points on a regular lattice centered on the origin. Number X, Y and Z set the count on each axis, and Multiplier sets the spacing.
Parameters
| Parameter | Type | Default | Description |
|---|---|---|---|
| Number X | Integer | 1 | Number of points along X. Range 1 to 100, default 1. |
| Number Y | Integer | 1 | Number of points along Y. Range 1 to 100, default 1. |
| Number Z | Integer | 1 | Number of points along Z. Range 1 to 100, default 1. |
| Multiplier | Float | 0.05 | Distance between neighboring points on every axis. Range -1 to 1, default 0.05. |
Read the full description
The node writes Number X * Number Y * Number Z points. Point (x, y, z) is placed at X = x * Multiplier - offset X, Y = y * Multiplier - offset Y and Z = z * Multiplier - offset Z, where each offset is (count - 1) * Multiplier / 2. The lattice is therefore centered on the origin and Multiplier is both the spacing between neighbors and the scale of the whole grid.
The points are written with X changing fastest, then Y, then Z. With the defaults (1 point on each axis, Multiplier 0.05) the output is a single point at the origin. Setting Number Z to 1 gives a flat grid in the Z = 0 plane.
A negative Multiplier mirrors the lattice. Each count is limited to 100 by the control, which allows up to 1,000,000 points.
The output contains points only. vJSONGridConnect builds edge connectivity for a grid point array.
Example Connections
- Draw the grid
- Animate the grid with vArrayWave
vJSONPointsOnGrid.Output -> vJSONCameraProjection.ArrayA
vJSONCameraProjection.Output -> vJSONShapeRender.ArrayPoint
Background.Output -> vJSONShapeRender.Input
vJSONPointsOnGrid.Output -> vJSONWave.ArrayA
vJSONWave.Output -> vJSONCameraProjection.ArrayA