vScriptValShapeRender
Create a polygon dot shapes from a ScriptVal based Lua table of XY point pairs
Mograph / ScriptValScriptValArrayJSON
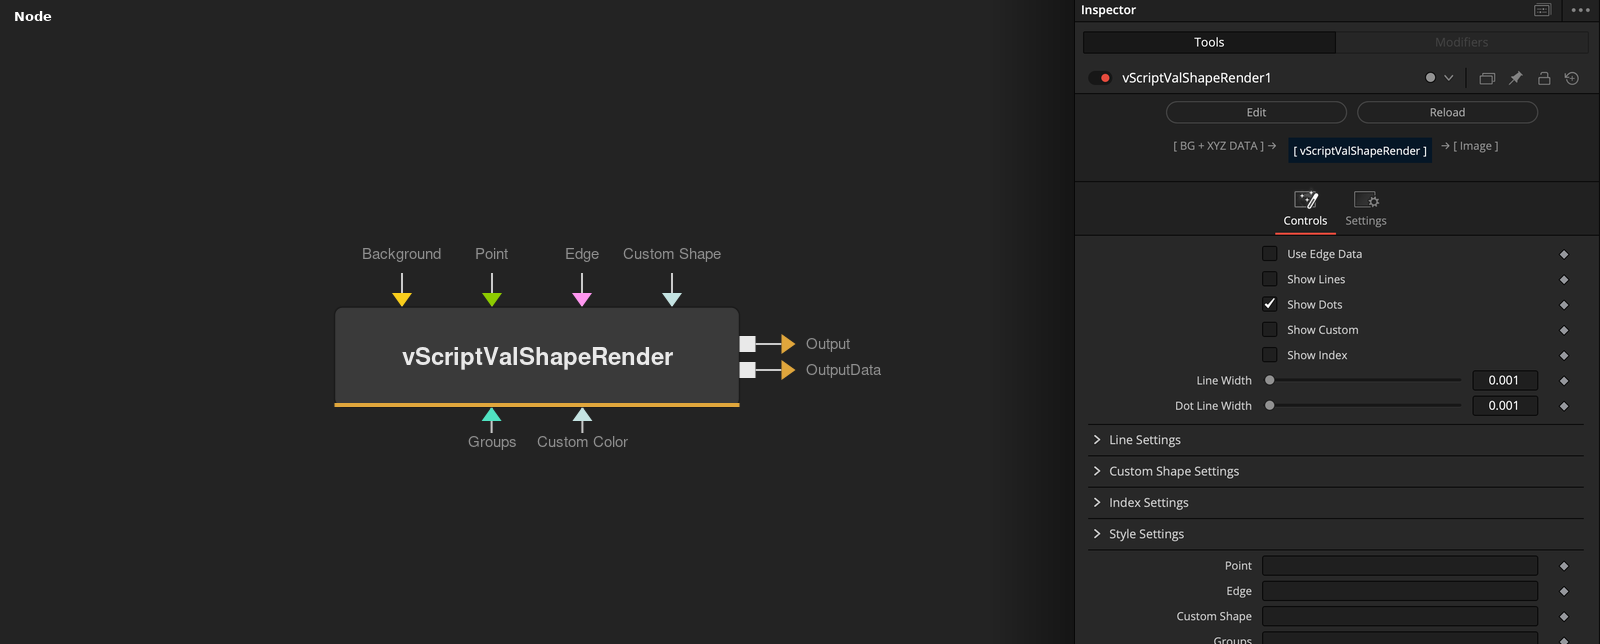
Parameters
| Parameter | Type | Default | Description |
|---|---|---|---|
| Use Edge Data | Integer | 0 | Draws the edge list instead of connecting points in order. |
| Show Lines | Integer | 0 | Draws the lines. |
| Show Dots | Integer | 1 | Draws a dot at each point. |
| Show Custom | Integer | 0 | Draws the custom shapes. |
| Show Index | Integer | 0 | Draws the index number at each point. |
+56 more parameters
| Parameter | Type | Default | Description |
|---|---|---|---|
| Line Width | Float | 0.001 | Width of the lines. |
| Dot Line Width | Float | 0.001 | Outline width of the dots. |
| Connect Text Groups | Integer | 0 | Connects the points of each text group. |
| Render Outline Lines | Integer | 1 | Draws the lines as outlines. |
| Close Edge Loops | Integer | 1 | Connects the end of each edge loop to its start. |
| Max XY Line Distance | Float | 0.0 | Longest line that is drawn. 0 means no limit. |
| Red | Float | 0 | Color for the line. |
| Green | Float | 1 | Color for the line. |
| Blue | Float | 1 | Color for the line. |
| Alpha | Float | 1.0 | Color for the line. |
| Hide Default Dots | Integer | 0 | Hides the built-in dots. |
| Render Outline Dots | Integer | 0 | Draws the dots as outlines. |
| Dot Sides | Integer | 6 | Number of sides of each dot. |
| Dot Radius | Float | 0.01 | Radius of the dots. |
| Dots Scale | Float | 1.0 | Scales the dots. |
| Color | Dropdown | Default | Default or Custom color. |
| Red | Float | 1.0 | Color for the line. |
| Green | Float | 0.0 | Color for the line. |
| Blue | Float | 0.5 | Color for the line. |
| Alpha | Float | 1.0 | Color for the line. |
| Color | Dropdown | Default | Default or Custom color. |
| Red | Float | 0 | Color for the line. |
| Green | Float | 1 | Color for the line. |
| Blue | Float | 1 | Color for the line. |
| Alpha | Float | 1.0 | Color for the line. |
| Render Outline Shape | Integer | 0 | Draws the custom shapes as outlines. |
| Render Outline Background | Integer | 1 | Draws the outline of the shape background. |
| Show / Hide Background | Integer | 0 | — |
| Shape Outline | Float | 0.002 | Outline width of the shapes. |
| Background Outline | Float | 0.002 | Outline width of the background. |
| Shape Scale | Float | 1.0 | Scale of the custom shapes. |
| Color | Dropdown | Default | Default or Custom color. |
| Red | Float | 1.0 | Color for the line. |
| Green | Float | 0.9 | Color for the line. |
| Blue | Float | 0.6 | Color for the line. |
| Alpha | Float | 1.0 | Color for the line. |
| Red | Float | 0.079 | Color for the line. |
| Green | Float | 0.079 | Color for the line. |
| Blue | Float | 0.079 | Color for the line. |
| Alpha | Float | 1.0 | Color for the line. |
| Text Size | Float | 0.025 | Size of the index text. |
| Text Style | Dropdown | Bold | Regular or Bold. |
| Red | Float | 1.0 | Color for the line. |
| Green | Float | 1 | Color for the line. |
| Blue | Float | 1 | Color for the line. |
| Alpha | Float | 1.0 | Color for the line. |
| Filter | Dropdown | Gaussian | — |
| Soft Edge | Float | 0 | — |
| Line Type | Dropdown | Solid | Solid, Dash, Dot, Dash Dot, or Dash Dot Dot. |
| Join Type | Dropdown | 2.0 | Bevel or Round corners. |
| Input | Image | — | Image that the result is drawn onto. |
| Point | ScriptVal | — | — |
| Edge | ScriptVal | — | — |
| Custom Shape | ScriptVal | — | — |
| Groups | ScriptVal | — | — |
| Custom Color | ScriptVal | — | — |
Example Connections
- Example 1
vScriptValFromOBJ.ScriptValPoints -> vScriptValCameraProjection.ScriptVal
    vScriptValFromOBJ.ScriptValEdges -> vScriptValShapeRender.ScriptValEdge
    vScriptValCameraProjection.Output -> vScriptValShapeRender.ScriptValPoint
    Background.Output -> vScriptValShapeRender.Input