vScriptValRenderGrid
Render a reference grid overlay with optional axis lines.
Mograph / ScriptValScriptValArrayJSON
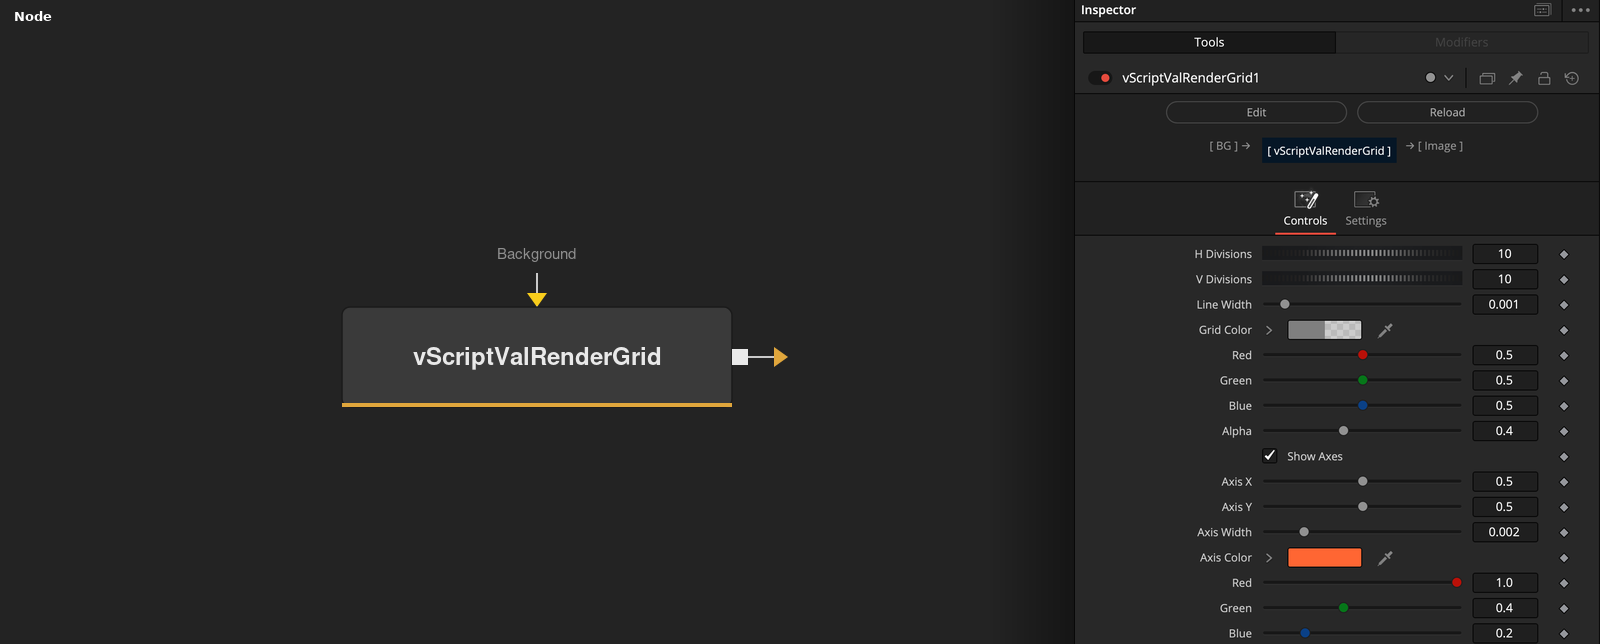
Parameters
| Parameter | Type | Default | Description |
|---|---|---|---|
| H Divisions | Integer | 10 | Number of horizontal divisions. |
| V Divisions | Integer | 10 | Number of vertical divisions. |
| Line Width | Float | 0.001 | Width of the lines. |
| Red | Float | 0.5 | Color for the grid. |
| Green | Float | 0.5 | Color for the grid. |
+11 more parameters
| Parameter | Type | Default | Description |
|---|---|---|---|
| Blue | Float | 0.5 | Color for the grid. |
| Alpha | Float | 0.4 | Color for the grid. |
| Show Axes | Integer | 1 | Draws the two axis lines. |
| Axis X | Float | 0.5 | Position of the vertical axis. |
| Axis Y | Float | 0.5 | Position of the horizontal axis. |
| Axis Width | Float | 0.002 | Width of the axis lines. |
| Red | Float | 1.0 | Color for the grid. |
| Green | Float | 0.4 | Color for the grid. |
| Blue | Float | 0.2 | Color for the grid. |
| Alpha | Float | 1.0 | Color for the grid. |
| Input | Image | — | Image that the result is drawn onto. |