vArrayRenderLineGraph
Render a line graph from an array of scalar values.
Mograph / ArrayArrayScriptValJSON
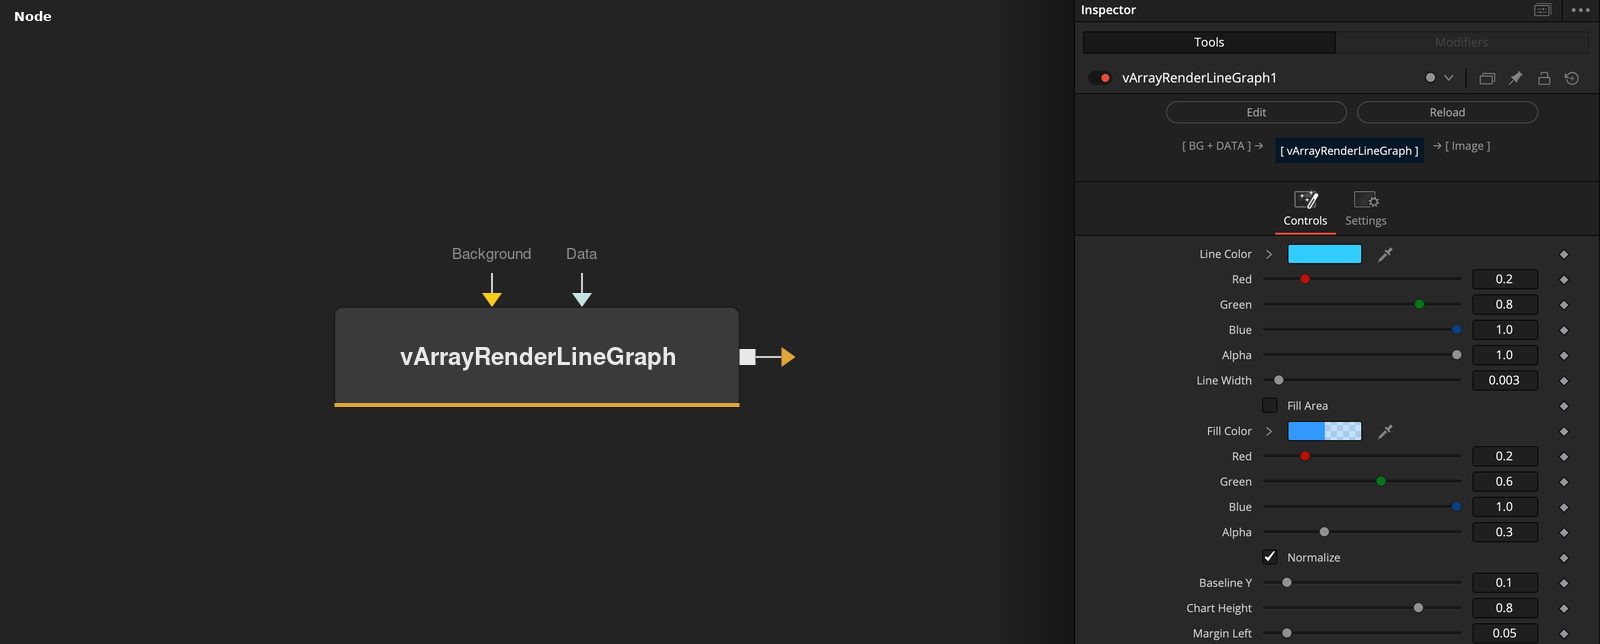
Parameters
| Parameter | Type | Default | Description |
|---|---|---|---|
| Red | Float | 0.2 | Color for the line. |
| Green | Float | 0.8 | Color for the line. |
| Blue | Float | 1.0 | Color for the line. |
| Alpha | Float | 1.0 | Color for the line. |
| Line Width | Float | 0.003 | Width of the lines. |
+12 more parameters
| Parameter | Type | Default | Description |
|---|---|---|---|
| Fill Area | Integer | 0 | Fills the area under the line. |
| Red | Float | 0.2 | Color for the line. |
| Green | Float | 0.6 | Color for the line. |
| Blue | Float | 1.0 | Color for the line. |
| Alpha | Float | 0.3 | Color for the line. |
| Normalize | Integer | 1 | Scales the values to fill the chart height. |
| Baseline Y | Float | 0.1 | Vertical position of the chart baseline. |
| Chart Height | Float | 0.8 | Height of the chart. |
| Margin Left | Float | 0.05 | Space left of the chart. |
| Margin Right | Float | 0.05 | Space right of the chart. |
| Input | Image | — | Image that the result is drawn onto. |
| Data | Text | — | Data to process. |