vJSONRenderScatterPlot
Render scatter plot points from an array of [x,y] or [x,y,r] pairs.
Mograph / JSONJSONScriptValArray
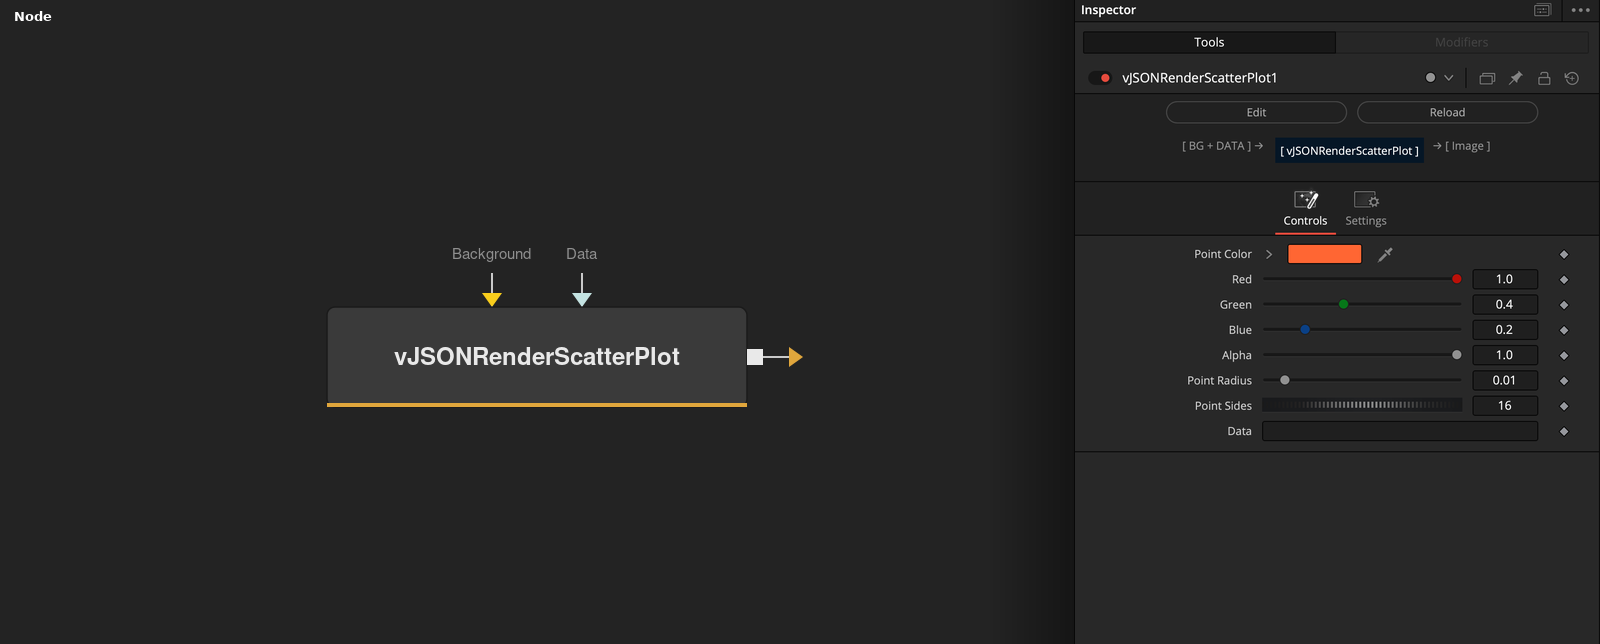
Parameters
| Parameter | Type | Default | Description |
|---|---|---|---|
| Red | Float | 1.0 | Color for the point. |
| Green | Float | 0.4 | Color for the point. |
| Blue | Float | 0.2 | Color for the point. |
| Alpha | Float | 1.0 | Color for the point. |
| Point Radius | Float | 0.01 | Radius of each point. |
+3 more parameters
| Parameter | Type | Default | Description |
|---|---|---|---|
| Point Sides | Integer | 16 | Sides of each point. |
| Input | Image | — | Image that the result is drawn onto. |
| Data | Text | — | Data to process. |